 FlaskConnect™
Home › Apparatus gallery › Acids, bases and pKa (which way the equilibrium lies)
Acid–Base Reaction Diagrams: Using pKa to See Which Way the Equilibrium Lies (Curved Arrows, Baking Soda, Extraction)
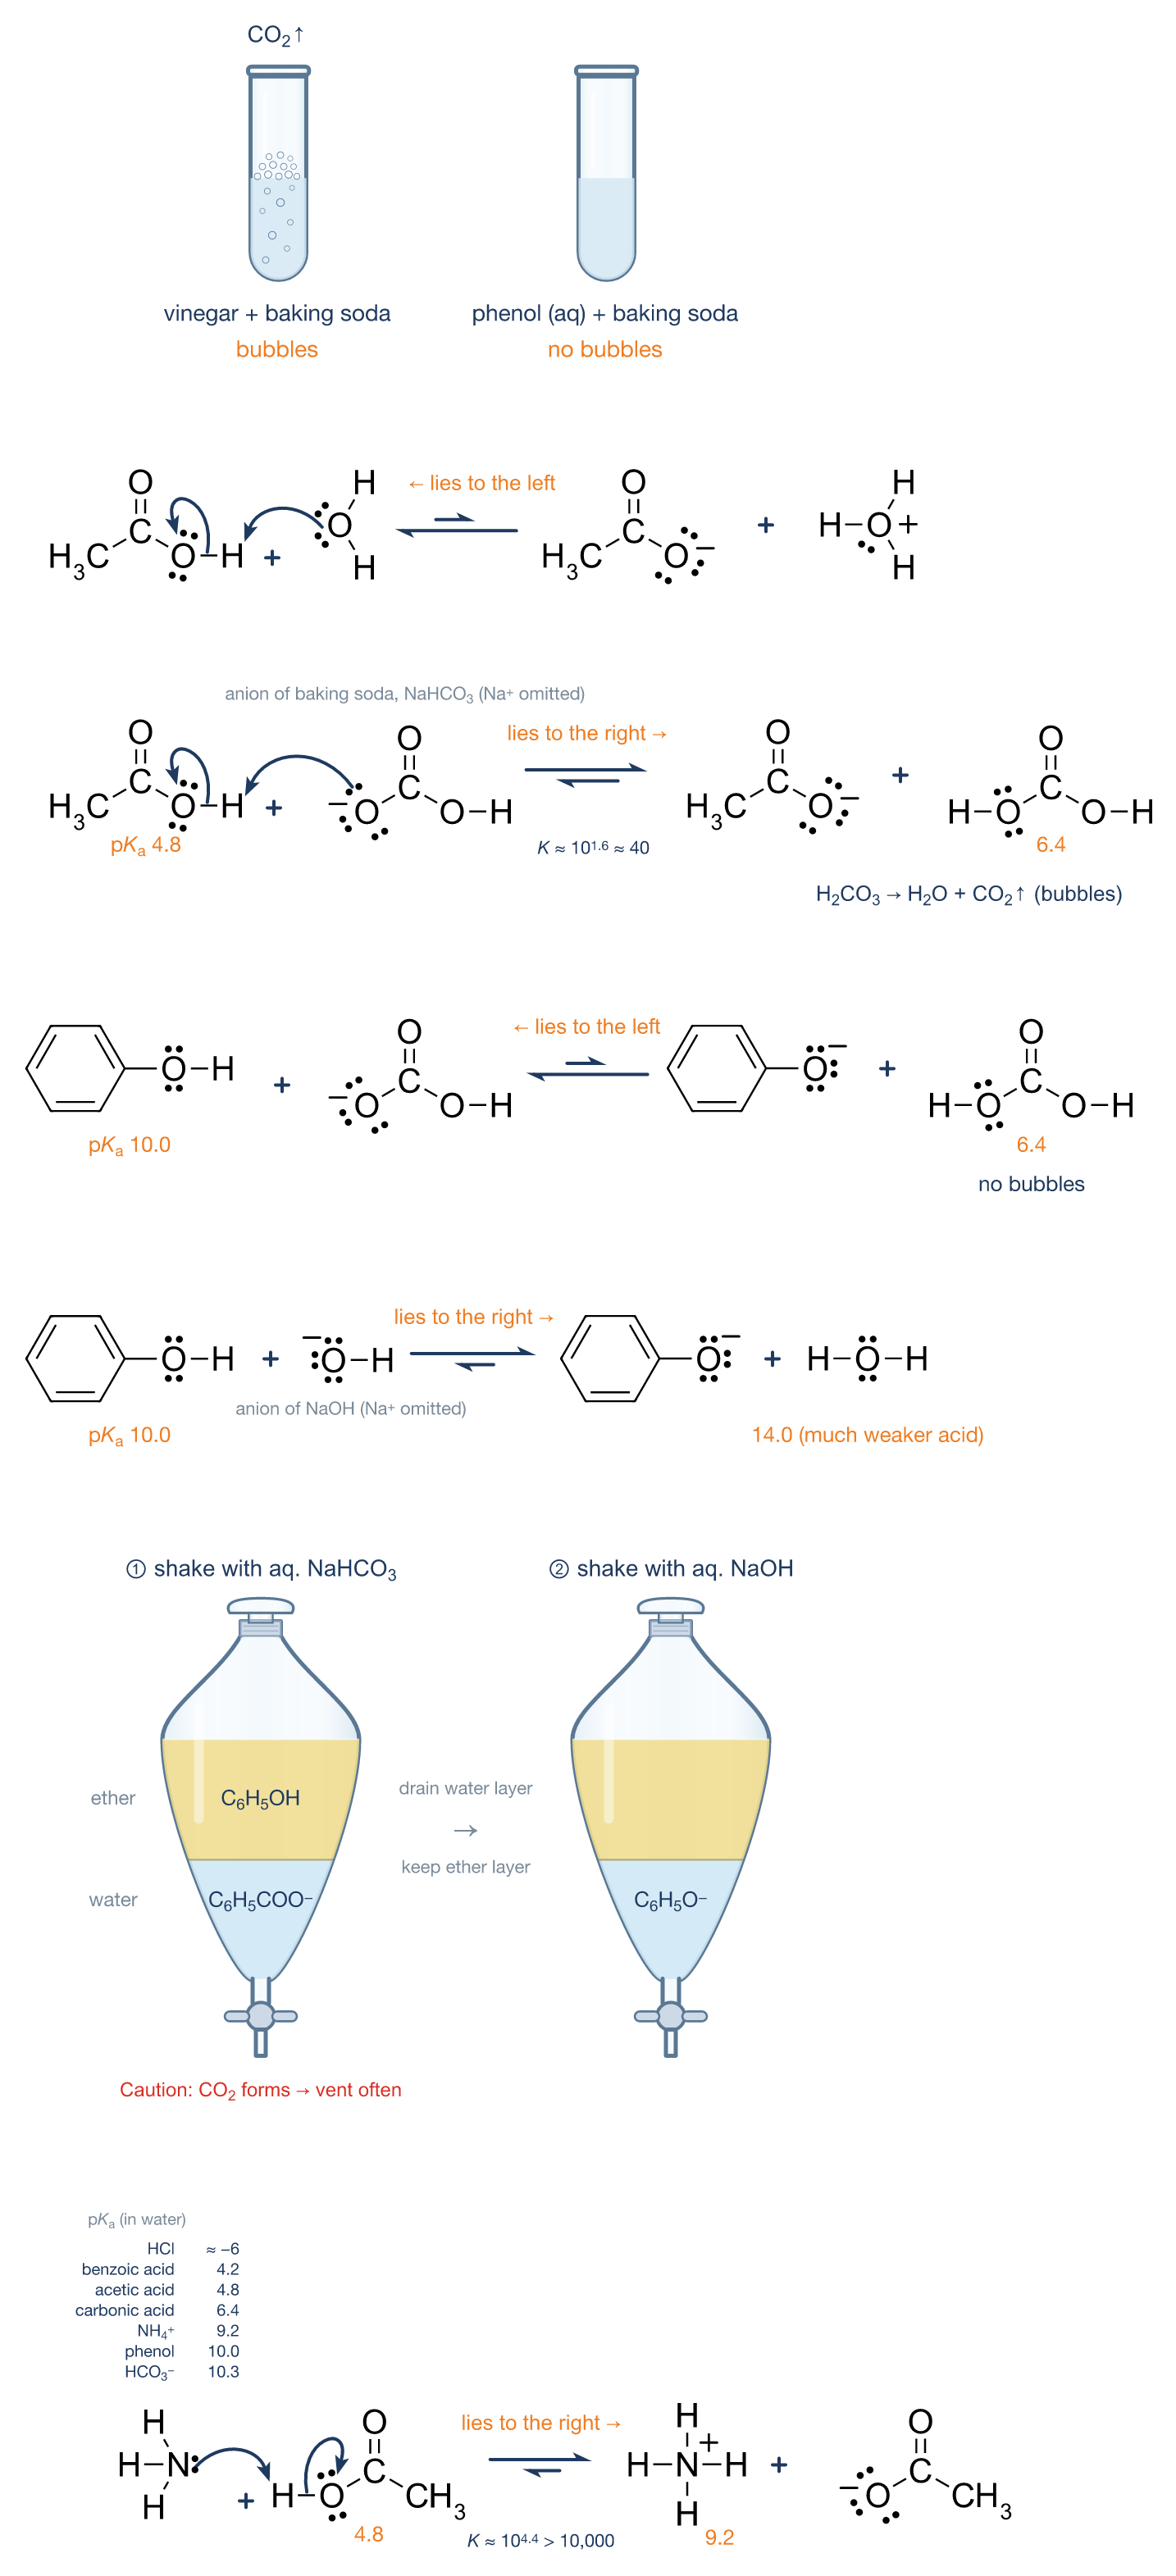
Vinegar fizzes with baking soda, but phenol doesn't. You can tell which way an acid–base reaction goes by comparing the pKa of the acid on each side: the equilibrium lies toward the side that forms the acid with the higher pKa (the weaker acid). Each ⇌ is drawn with the longer arrow toward the favored side. These figures were drawn in FlaskConnect for Episode 2 of “Organic Chemistry with Flako” on YouTube.
.chemc is a FlaskConnect drawing file. Open it in FlaskConnect to adjust the text and layout before exporting (double-click it on Mac or Windows; on iPad, open it from the Files app and choose FlaskConnect). Opening, moving and exporting are free; editing structures and schemes requires Pro.
Free to use without attribution in lab reports, theses, teaching materials, slides, supporting information and on the web, including modified and commercial use. Released under CC0 1.0 (public domain dedication).
Features used in this figure
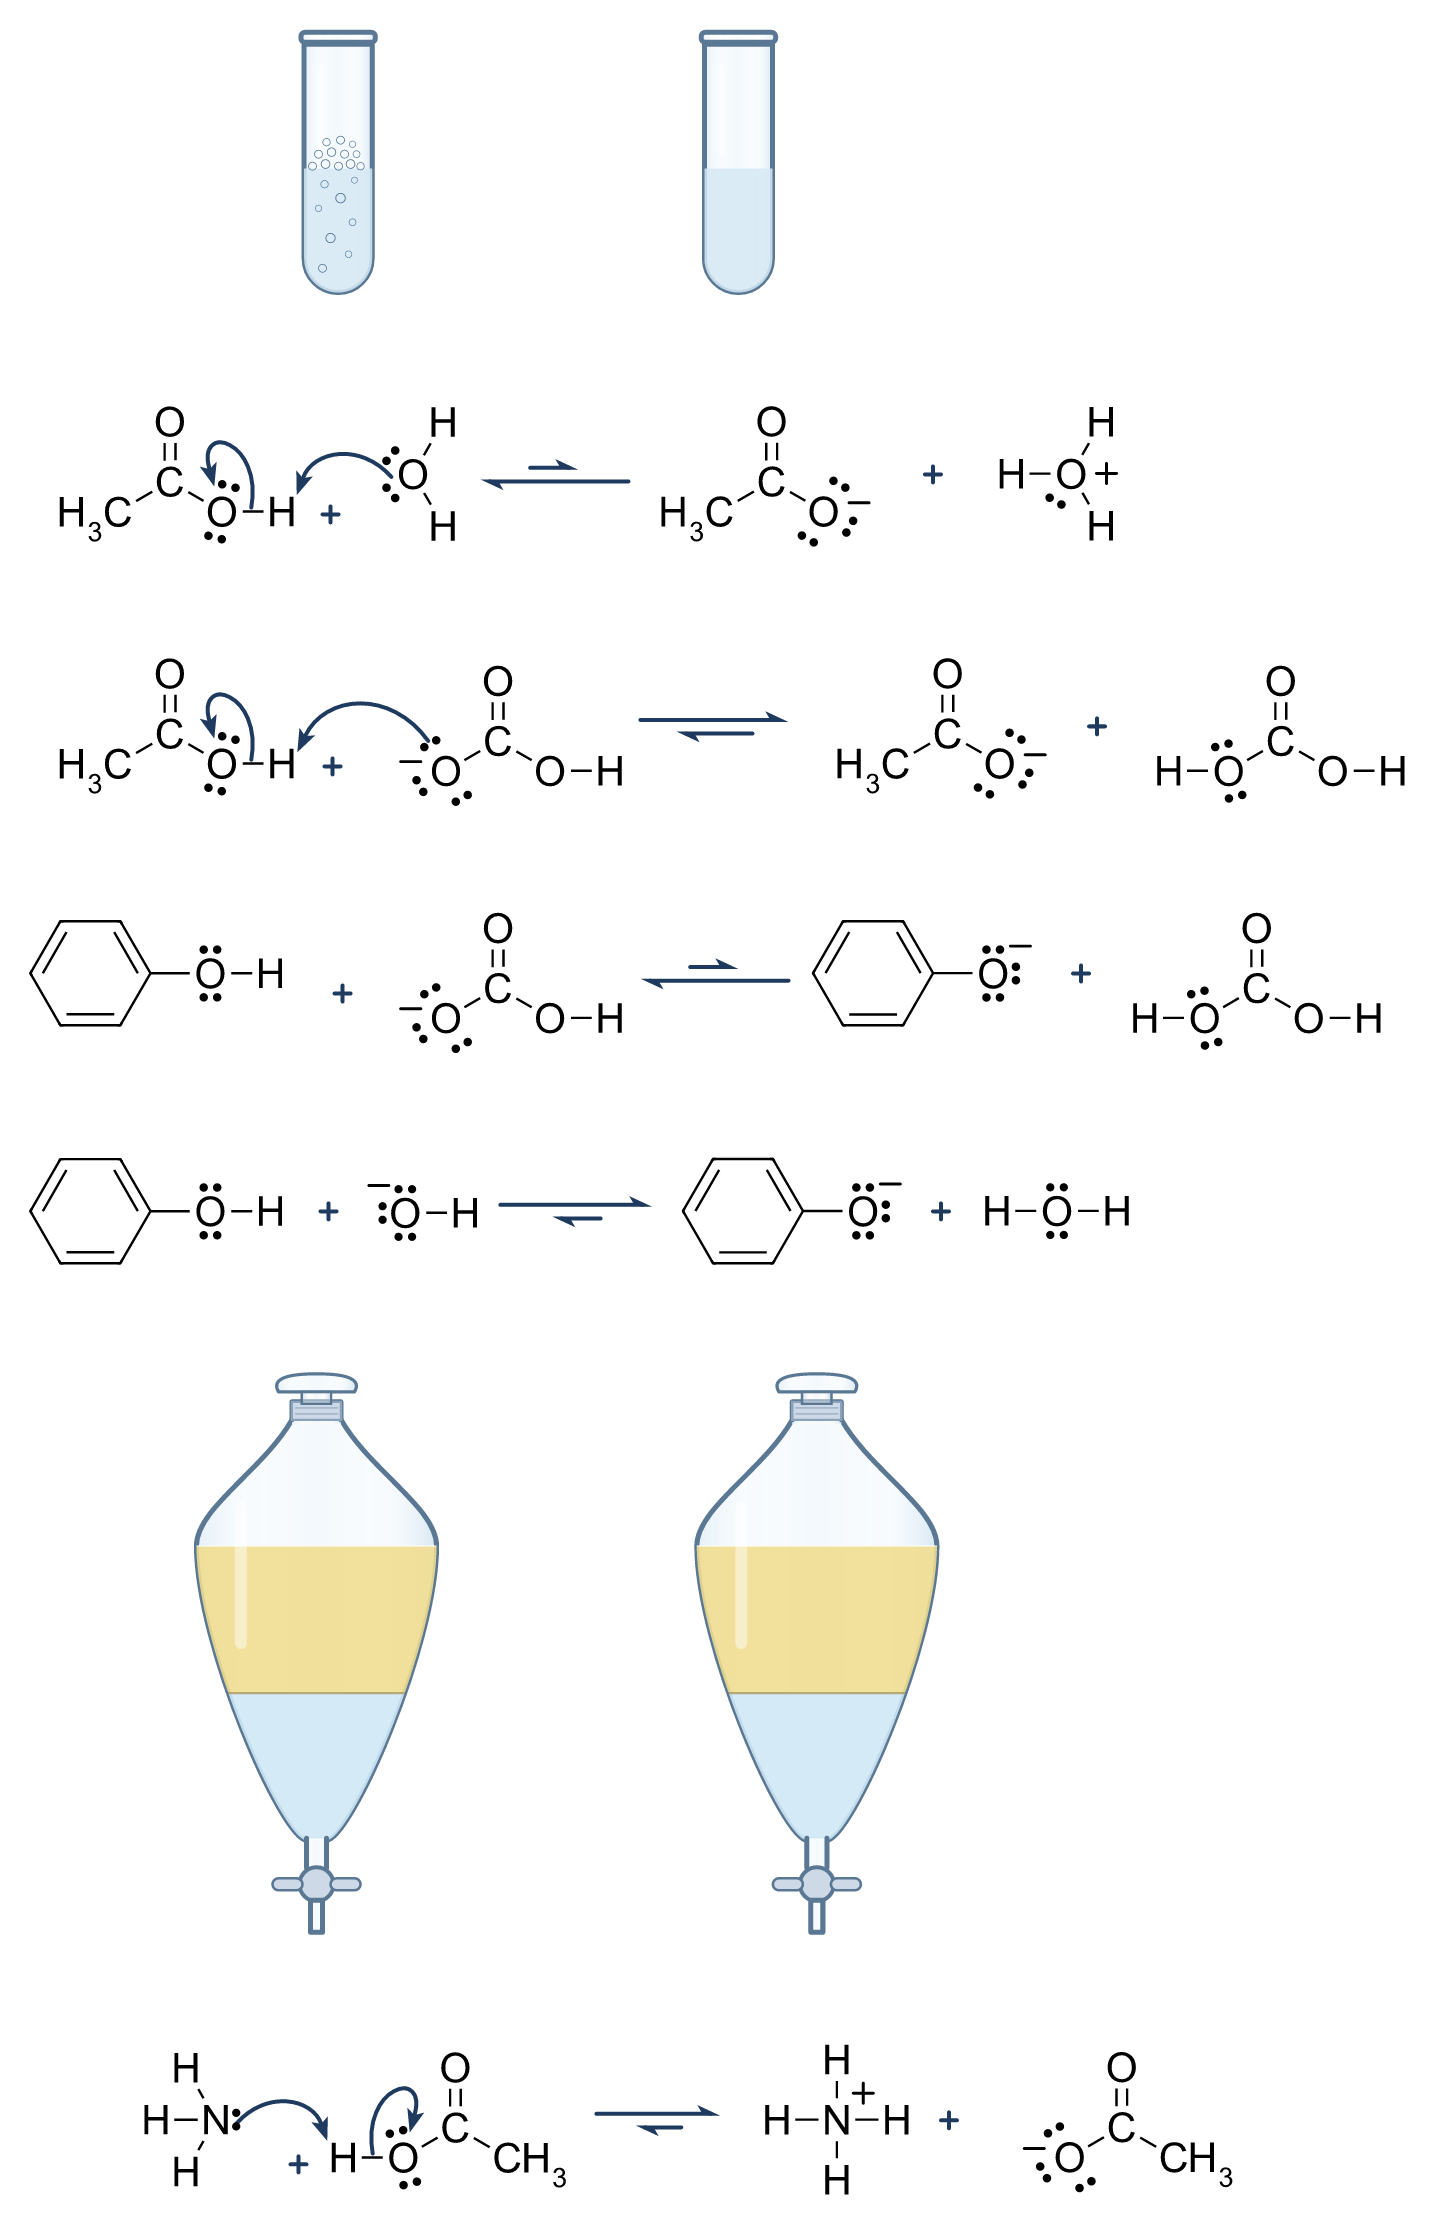
- Structures (the moving H and the atoms that give or take electron pairs drawn as atoms)
- Lone pairs and charges
- Curved arrows (base's lone pair → H, O–H bond → O)
- Equilibrium arrows ⇌ (longer arrow toward the favored side)
- Test tubes and separatory funnels (Apparatus tab), with pKa and K notes
How to draw it in FlaskConnect
- In the Structure tab, place atoms and connect them with bonds (or load a structure by name or SMILES). Draw the moving H and the O or N that gives or takes a pair as atoms.
- Right-click an atom and choose Lone Pairs to set the number of pairs (three on a basic O⁻, two on the O of water, one on the O of H₃O⁺). Add charges with the charge tool.
- With the curved-arrow tool, drag from the base's lone pair to the acid's H, and from the middle of the O–H bond to the O (the bonding pair stays on O, so O sits on the inside of the curve).
- Place the Equilibrium arrow ⇌ from the palette, then set Favored side (Products or Reactants) and Degree (Slight, Moderate or Strong) in its properties. The arrow toward the favored side stays long and the other one gets shorter.
- Test tubes and separatory funnels are in the Apparatus tab (free to draw). Change the amount of liquid with Fill level and the two layers with Upper layer ratio.
- Add the pKa values, the equilibrium constant and “lies to the right →” as text notes (use the formatting buttons for the italic K and the subscript a).
Notation tips
- Compare acid with acid, one on each side: the acid on the left (acetic acid, 4.8) and the acid that forms on the right (carbonic acid, 6.4).
- The equilibrium lies toward the side that forms the acid with the higher pKa (the weaker acid): strong acid + strong base → weak acid + weak base.
- The smaller the pKa, the stronger the acid (pKa = −log Ka), and one unit is a factor of ten. The equilibrium constant is 10 to the power (pKa of the acid on the right − pKa of the acid on the left): about 10^1.6 ≈ 40 for acetic acid + HCO₃⁻, and 10^4.4, more than 10,000, for ammonia + acetic acid.
- For phenol + HCO₃⁻, comparing with the pKa of HCO₃⁻ itself (10.3) is a mistake. 10.3 is the value for HCO₃⁻ acting as an acid and giving up H⁺; in this reaction HCO₃⁻ is the base. Compare with the carbonic acid that forms (6.4): the equilibrium lies to the left and there are no bubbles.
- The 6.4 for carbonic acid is an apparent value that counts dissolved CO₂ as H₂CO₃. The H₂CO₃ that forms breaks down into H₂O and CO₂, and the CO₂ bubbling off pushes the reaction further to the right.
- The negative charge of acetate and similar ions is shared by both O atoms (resonance); here it is placed on the O that lost the H so the curved arrows are easy to follow.
- The pKa of water is 14.0 and that of hydronium (H₃O⁺) is 0, both defined the same way as the other values in water. Older tables list 15.7 and −1.7; either way, acetic acid + water lies to the left and phenol + hydroxide lies to the right.
- Shaking with aqueous sodium bicarbonate in a separatory funnel releases CO₂. Hold the stopper and the funnel, invert it and open the stopcock to vent often. Ether is highly flammable: work away from ignition sources, with supervision.
pKa values (water, 25 °C) are from the tables in the CRC Handbook of Chemistry and Physics, 84th ed. (2004): acetic acid 4.76, benzoic acid 4.20, carbonic acid 6.35 and 10.33, phenol 9.99, ammonium ion 9.25 (from the pKb of ammonia, 4.75). Water 14.0 and hydronium 0 follow the Evans pKa table as revised by the ACS Division of Organic Chemistry in 2024 and Silverstein and Heller (J. Chem. Educ. 2017, 94, 690); hydrogen chloride, about −6, is an estimate from calculations (−5.9 ± 0.4; Trummal et al., J. Phys. Chem. A 2016, 120, 3663). They are rounded to one decimal place in the figures. The figures were drawn anew in FlaskConnect and are not reproductions of figures from textbooks or other sources.
Draw this in the app
This figure was drawn in FlaskConnect. Call up structures by name or SMILES, and add lone pairs, curved arrows and arrow text (subscripts and superscripts with buttons) in place. Drawing structures and schemes is Pro (US$3.99/month, first month free, or US$39.99 once); apparatus drawing and export are free.